Resting heart rate falls with age through childhood, then stays near 70 BPM in adults in CDC data on 35,302 people. Adults’ middle 90% spans about 54–93 BPM. Compare your resting pulse with people your age below, or use the full age-and-sex table.
Your pulse vs. your age.
Your resting pulse
72 BPM at rest is inside the 60–100 range the AHA uses for adults — higher than about 56 in 100 people aged 40–59 (CDC).
Resting pulse · ages 40–59 · CDC
Percentile
56of 100
Middle value
70bpm
90 in 100 between
54–91bpm
CDC sample
4,968people
The curve, from babies to 80+.
Line = middle value · dark band = middle half (25th–75th percentile) · light band = middle 90 in 100 (5th–95th). Beats per minute at rest, CDC/NCHS NHANES 1999–2008.
Every age group, women and men.
Resting pulse by age (BPM) — middle value and the range for 90 in 100 people
| Age | Middle · everyone | Women | Men | 90 in 100 between | Middle half | People measured |
|---|---|---|---|---|---|---|
| Under 1 year | 126 | 127 | 125 | 103–156 | 116–137 | 1,903 |
| 1 year | 116 | 117 | 114 | 95–138 | 108–123 | 1,345 |
| 2–3 years | 105 | 107 | 104 | 86–124 | 97–113 | 2,255 |
| 4–5 years | 94 | 95 | 92 | 75–114 | 86–102 | 1,764 |
| 6–8 years | 85 | 87 | 83 | 68–105 | 78–93 | 2,476 |
| 9–11 years | 81 | 83 | 78 | 63–101 | 73–89 | 2,366 |
| 12–15 years | 76 | 79 | 74 | 58–98 | 68–85 | 4,500 |
| 16–19 years | 73 | 77 | 69 | 54–95 | 64–82 | 4,493 |
| 20–39 years | 71 | 74 | 69 | 54–92 | 64–79 | 6,506 |
| 40–59 years | 70 | 71 | 68 | 54–91 | 62–78 | 4,968 |
| 60–79 years | 69 | 70 | 67 | 54–91 | 62–77 | 2,310 |
| 80 years and over | 70 | 71 | 68 | 54–93 | 62–77 | 416 |
Ages 5 and up: pulse at the wrist counted for 30 seconds and doubled; younger children: heartbeat counted with a stethoscope. Download every percentile (1st–99th) as CSV — free to reuse; please cite “CheckMyBPM (2026), resting pulse percentiles by age, from CDC/NCHS NHANES 1999–2008.”
Children’s heart rate by age
Children’s hearts beat faster, and the number drops quickly in the first years. Middle resting values in the CDC data:
- Under 1 year: 126 BPM (90 in 100 between 103 and 156)
- 1 year: 116 BPM (90 in 100 between 95 and 138)
- 2–3 years: 105 BPM (90 in 100 between 86 and 124)
- 4–5 years: 94 BPM (90 in 100 between 75 and 114)
- 6–8 years: 85 BPM (90 in 100 between 68 and 105)
- 9–11 years: 81 BPM (90 in 100 between 63 and 101)
- 12–15 years: 76 BPM (90 in 100 between 58 and 98)
A crying, feeding or just-woken child will read higher. For a child, the 60–100 adult range doesn’t apply — ask your pediatrician about your child’s numbers.
Women vs. men
Women and girls run a few beats higher than men and boys at almost every age — 3 to 8 beats in the middle value. Adults:
- 16–19: women 77 · men 69 BPM
- 20–39: women 74 · men 69 BPM
- 40–59: women 71 · men 68 BPM
- 60–79: women 70 · men 67 BPM
- 80+: women 71 · men 68 BPM
Averaged over all adults, the CDC report puts women at 74 BPM and men at 71. If you are comparing yourself, pick your sex in the tool above — the percentile shifts by a few points.
Normal heart rate for older adults
The resting pulse doesn’t climb or fall much with age in adults. In the CDC data the middle value at 60–79 is 69 BPM (90 in 100 between 54 and 91), and at 80 and over it is 70 BPM (54–93). In a study of 92,457 trackers, the average rose until about age 50 and then trended down, and people over 60 had the steadiest day-to-day numbers.
What does change is the top end: estimated maximum heart rate falls with age. If you take a medicine that slows your pulse, these tables won’t fit you, so ask your clinician what to expect.
Babies and toddlers
A review of 69 studies covering 143,346 children put the median heart rate at 127 BPM at birth, rising to 145 BPM at about 1 month, then falling to 113 BPM by age 2. Children’s ranges are wide, so see your pediatrician rather than a chart if you are worried.
Why your number may not match the table
The CDC numbers are a seated pulse after about 4 minutes of quiet rest, counted once by an examiner. A reading taken while walking, after coffee, or from a watch during the day will usually be higher. For a fair comparison, use a number from right after you wake up, or sit quietly for 5 minutes first.
The table also leaves out people taking medicines that change pulse, pregnant women, and people with an infection or thyroid problem at the time — so it describes healthy people at rest, not everyone.
When to talk to a clinician
A single reading moves around a lot. If your resting pulse is above 100 on most mornings, or below 50 and you are not a trained endurance athlete, mention it at your next checkup — bring your readings.
If a fast or slow pulse comes with chest pain, fainting, feeling about to faint, or trouble breathing, call 911 or your local emergency number now.

Want a real reading? Pulse reads it with your iPhone camera.
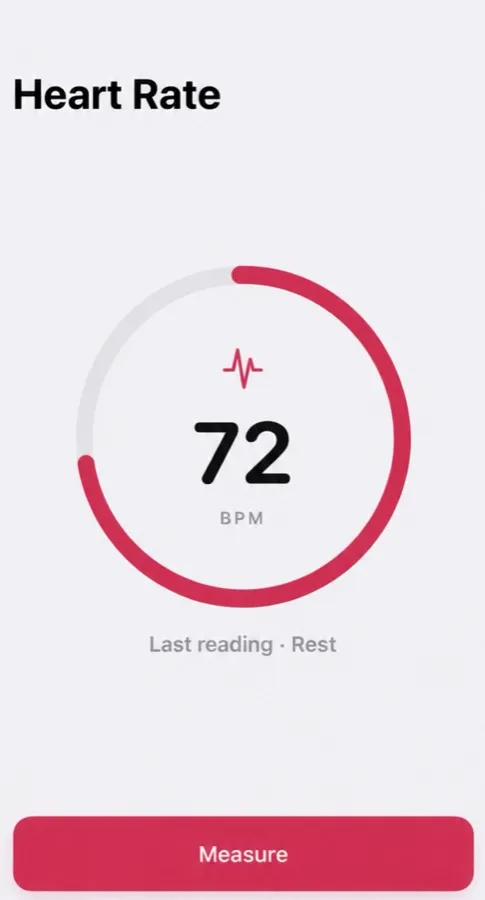
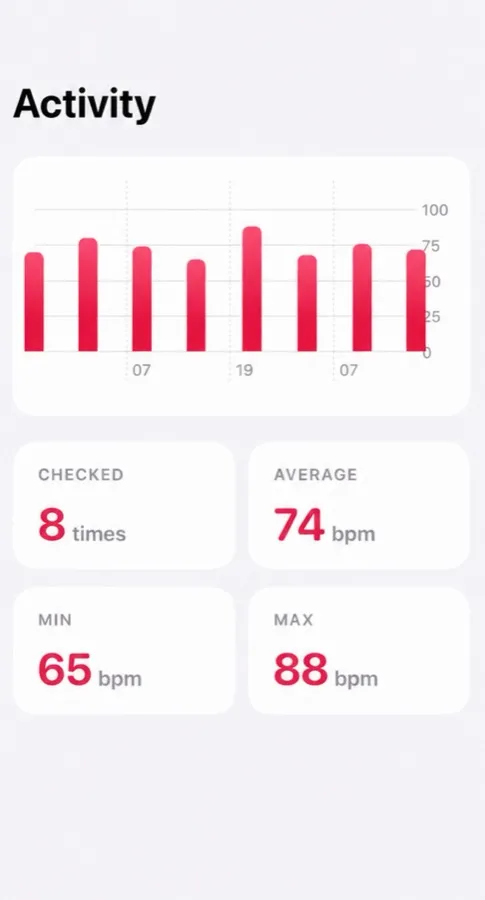
Cover the back camera with your fingertip — Pulse reads your heart rate from the light and keeps every reading, with your average, lowest and highest.
- Reads your pulse in about 15 seconds
- Tag each reading: morning, rest, workout, before bed
- History with average, min and max
Free to download, optional Pro. Not a medical device: Pulse reads and keeps your pulse, and it does not detect or predict disease. What the app does
Questions people ask
What is a normal resting heart rate by age?
For adults the American Heart Association uses 60–100 BPM. In CDC data the middle resting pulse is about 70 for every adult age group; children run higher — 126 under age 1, 105 at 2–3, 85 at 6–8, 76 at 12–15.
Do women have a higher heart rate than men?
Yes, by a few beats on average. At ages 20–39 the middle resting pulse was 74 for women and 69 for men in the CDC data. The CDC report also found that men’s resting pulse levels off in early adulthood, while women’s levels off later, in middle age.
Does resting heart rate go up with age?
Not in this data. After the teenage years the middle value barely moves: 71 at 20–39, 70 at 40–59, 69 at 60–79 and 70 at 80 and over. Maximum heart rate is what falls with age — see max heart rate.
Where do these numbers come from?
From the CDC’s National Health and Nutrition Examination Survey, 1999–2008: trained examiners counted the seated pulse of 35,302 people after about 4 minutes of quiet rest, leaving out anyone with a condition or medicine that changes pulse (NHSR No. 41, 2011).
General information, not medical advice — medical disclaimer. Reviewed : sources and reference dates are listed below.
Sources · numbers checked · how we calculate · report an error
- Quer G, Gouda P, Galarnyk M, Topol EJ, Steinhubl SR. Inter- and intraindividual variability in daily resting heart rate and its associations with age, sex, sleep, BMI, and time of year. PLoS One. 2020;15(2):e0227709.
- Fleming S, Thompson M, Stevens R, et al. Normal ranges of heart rate and respiratory rate in children from birth to 18 years of age. Lancet. 2011;377(9770):1011–1018.
- Ostchega Y, Porter KS, Hughes J, Dillon CF, Nwankwo T. Resting pulse rate reference data for children, adolescents, and adults: United States, 1999–2008. National Health Statistics Reports No. 41. NCHS, 2011.
- American Heart Association. Target Heart Rates Chart.